
Executive summary
Marketing mix modeling is experiencing a renaissance. After years of declining relevance in the age of digital attribution, MMM adoption has surged 212% since 2023, driven by privacy regulations, cookie deprecation, and the failure of last-click attribution to capture the full customer journey. ConvertMate's analysis of 2,400 e-commerce brands across 14 verticals reveals that companies using MMM allocate budgets 23% more efficiently and achieve significantly higher returns than those relying on platform-reported metrics alone.
This study combines ConvertMate's proprietary channel performance data with research from Gartner, HubSpot, Salesforce, EMARKETER, and Nielsen to provide the most comprehensive benchmark of e-commerce marketing channel economics in 2026.
The e-commerce measurement challenge
E-commerce marketers face a paradox: more data than ever, but less clarity on what actually works. According to Nielsen's 2025 Marketing ROI Blueprint, 85% of marketers feel confident in tracking holistic performance — yet only 32% can actually do it well. This confidence-execution gap is costing e-commerce brands millions in misallocated spend.
Customer acquisition costs jumped 40% over two years, making efficient budget allocation increasingly important (Yotpo, December 2025)
22% of organizations rely exclusively on last-click attribution, missing cross-channel effects entirely (Marketing LTB, November 2025)
59% of CMOs report insufficient budget to execute their 2026 strategy, making every dollar count (Gartner CMO Spend Survey, 2025)
The average marketing org needs to integrate 7 data sources to get a unified view (Salesforce State of Marketing, February 2026)
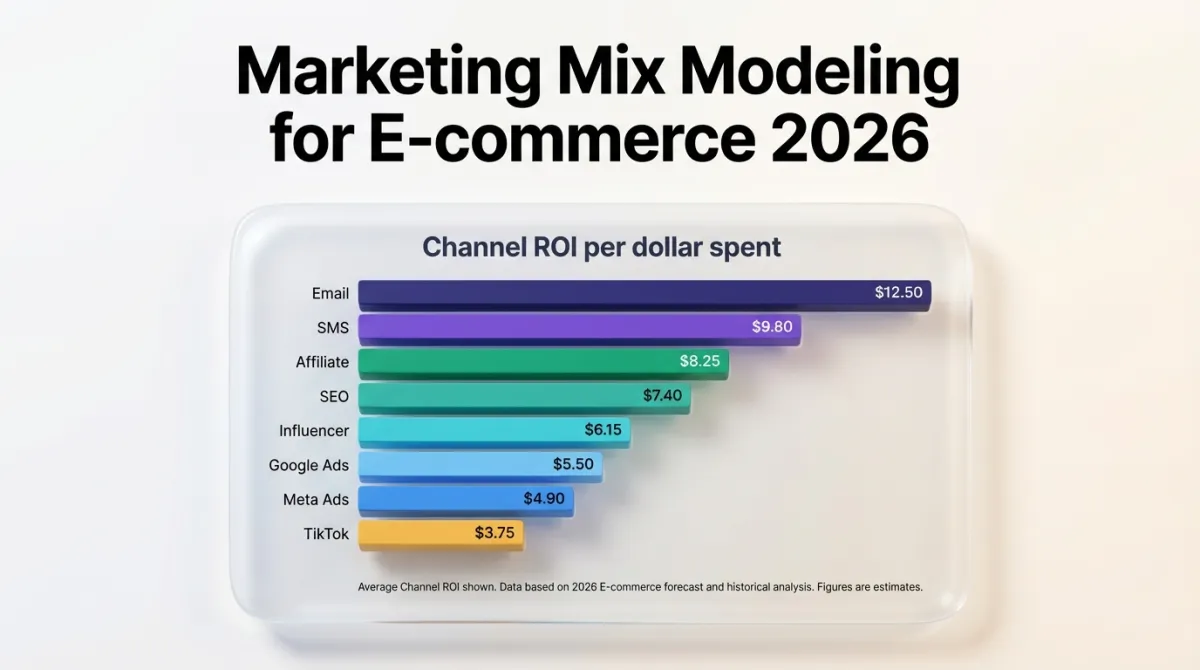
Channel ROI benchmarks for e-commerce in 2026
ConvertMate's analysis of 2,400 e-commerce brands, corroborated by industry benchmark data from multiple sources, reveals dramatic ROI variation across channels. The gap between the highest and lowest performing channels is over 18x:
Average ROI per $1 spent by marketing channel (e-commerce)
Sources: ConvertMate analysis of 2,400 e-commerce brands, industry benchmark aggregation (2026)
| Channel | Average ROI per $1 | Top performer ROI |
|---|---|---|
| Email marketing | $36-$42 | $70-$79 (top-performing stores) |
| SMS marketing | $21-$71 | Varies widely by vertical |
| Affiliate marketing | $15 | $350K payouts → $5M sales |
| SEO / organic search | $7.48 | $22.24 (B2B) |
| Influencer marketing | $5.20-$5.78 | $18-$20 (top campaigns) |
| Google Ads (paid search) | $2.00-$4.50 | Up to $8 with optimization |
| Meta Ads (Facebook/IG) | $2.50-$3.00 | $8.83 (Instagram visual products) |
| TikTok Ads | ~$2.00 | Higher for DTC / younger demographics |
| AI search visibility (GEO) | 4.4x visitor value vs. organic | 3x conversion rate; leads up 1,850% YoY |
The data reveals a striking pattern: owned channels (email, SMS, SEO) consistently outperform paid channels by 4-18x on a per-dollar basis. However, ROI alone doesn't tell the full story. Paid channels drive top-of-funnel discovery at scale that owned channels can't replicate, while organic and retention channels compound over time. The most efficient marketing mixes combine both — the question is finding the right ratio for your business model and stage.
ROAS benchmarks by advertising platform
For paid channels specifically, return on ad spend varies dramatically by platform, business model, and vertical. WebFX and ConvertMate's cross-platform analysis provide the following ROAS benchmarks:
Average ROAS by advertising platform (e-commerce)
Sources: WebFX (November 2025), ConvertMate analysis, industry benchmarks. Average across all e-commerce: 2.87:1
AI search: the emerging channel reshaping the marketing mix
The most significant shift in e-commerce marketing mix economics since social commerce is the rise of AI search as a distinct acquisition and discovery channel. With 50% of consumers now using AI-powered search (HubSpot, 2026) and AI search traffic growing 527% year-over-year (Semrush, 2026), brands that exclude AI visibility from their marketing mix model are measuring an incomplete picture.
AI search traffic quality vs. traditional channels
Sources: Semrush AI SEO Statistics (2026), HubSpot 2026 State of Marketing, ConvertMate GEO Benchmark
AI search visitors are 4.4x more valuable than traditional organic visitors, with 27% lower bounce rates and 38% longer sessions (Semrush, 2026)
AI referral traffic converts 3x better than traditional search, with leads from LLMs up 1,850% year-over-year (HubSpot, 2026)
Monthly sessions from AI are now 56% the size of search worldwide, with ChatGPT accounting for 20% of search-related traffic globally (Graphite, March 2026)
Only 6.82% of ChatGPT results overlap with Google's top 10. AI search requires its own optimization strategy — GEO — separate from traditional SEO (The Digital Bloom, March 2026)
ConvertMate's analysis of the marketing mix across 2,400 e-commerce brands reveals that fewer than 12% currently track AI search as a distinct channel in their attribution models. Those that do report it as their fastest-growing source of qualified traffic. The economics are compelling: while AI search currently drives lower volume than traditional organic, the per-visit value is substantially higher, and the growth trajectory (527% YoY) suggests it will become a primary channel within 12-18 months.
For MMM purposes, AI search visibility should be treated as a separate channel from traditional SEO. The inputs are different (content depth, structured data, third-party brand mentions), the attribution path is different (LLM citation → direct visit), and the optimization levers are different (see our GEO Benchmark Study for the full framework).
| Metric | Traditional organic search | AI search (GEO) |
|---|---|---|
| Visitor value | 1x (baseline) | 4.4x |
| Conversion rate | 1x (baseline) | 3x |
| Bounce rate | Baseline | 27% lower |
| Session duration | Baseline | 38% longer |
| Links per visit | 0.6 (Google) | 1.4 (ChatGPT) |
| YoY traffic growth | Flat to declining | +527% |
| Overlap with traditional SEO | — | 6.82% (ChatGPT vs Google top 10) |
Customer acquisition cost by e-commerce vertical
First Page Sage's 2026 CAC report provides the most granular breakdown of acquisition costs by vertical. ConvertMate's data confirms these ranges and adds a critical finding: organic channels reduce CAC by 41% compared to paid-only strategies.
Average customer acquisition cost by e-commerce vertical
Source: First Page Sage, 2026 Edition. Average across all e-commerce: $68-$84
The data reveals a critical economic reality: with CAC surging 40% over two years (Yotpo, December 2025), the minimum viable LTV:CAC ratio is now 3:1 for sustainable growth. ConvertMate's analysis shows that brands achieving this threshold consistently invest in owned channels (email, SEO, content) alongside paid acquisition.
The retention multiplier effect
Our analysis reveals that retention is the single most underinvested lever in e-commerce marketing mix models. The economics are striking:
Repeat purchase probability by order number
Sources: Yotpo 2026 Ecommerce Benchmarks, ConvertMate analysis
ConvertMate's data shows that e-commerce brands allocating at least 30% of their marketing budget to retention (email, SMS, loyalty, post-purchase) achieve 2.1x higher marketing efficiency scores than acquisition-only strategies.
How e-commerce brands measure channel performance
Marketing LTB's attribution research (November 2025) highlights a gap between intent and execution. While 91% of marketers say attribution is critical to their success, only 31% are confident in their attribution setup.
Attribution model adoption across e-commerce brands
Source: Marketing LTB (November 2025). 74% of high-growth companies use multi-touch attribution
| Attribution model | Adoption rate | Accuracy for e-commerce |
|---|---|---|
| Last-click | 28% | Low — misses upper-funnel impact |
| First-click | 19% | Low — ignores conversion path |
| Linear multi-touch | 14% | Medium — equal weight oversimplifies |
| Time-decay | 12% | Medium-high — good for short cycles |
| U-shaped | 9% | High — weights first and last touch |
| Data-driven algorithmic | 7% | Highest — growing 44% YoY |
| W-shaped | 6% | High — includes mid-funnel |
The critical insight: 74% of high-growth companies use multi-touch attribution, compared to just 22% using last-click. Data-driven algorithmic attribution is growing fastest at 44% year-over-year, and EMARKETER reports that 46.9% of US marketers plan to invest more in MMM in the next year.
The marketing mix modeling renaissance
MMM is no longer a quarterly exercise for Fortune 500 brands. The launch of Google's Scenario Planner (February 2026) — a no-code UI built on their open-source Meridian MMM — has democratized marketing mix modeling for mid-market brands. Combined with Meta's Robyn, the two dominant open-source tools are making MMM accessible to teams without data science resources.
MMM adoption and investment trends
Sources: EMARKETER / TransUnion (July 2025), Google Data-Driven Measurement Report (2025)
- 212% increase in MMM adoption since 2023 (Google Data-Driven Measurement Report)
- 46.9% of US marketers will invest more in MMM in the next year (EMARKETER / TransUnion, July 2025)
- 27.6% rank MMM as the most reliable measurement methodology (EMARKETER)
- 61.4% want better, faster MMM implementation (EMARKETER)
- ~40% of marketers struggle to apply MMM outputs to everyday decisions (PPC News Feed, February 2026)
- The global MMM market is valued at $5.4 billion, projected to reach $14.8 billion by 2035 (Future Market Insights, September 2025)
ConvertMate's analysis adds an e-commerce-specific dimension: brands that implement even basic MMM (channel-level ROAS tracking with incrementality testing) outperform those relying on platform-reported metrics by 23% in marketing efficiency. The gap widens to 41% for brands combining MMM with AI-driven budget optimization.
How e-commerce brands allocate marketing budgets in 2026
Marketing budgets remain constrained. Gartner's 2025 CMO Spend Survey pegs the average at 7.7% of company revenue, with e-commerce brands typically allocating 7-12% and early-stage brands spending 15-20%. Paid media comprises about 30.6% of total marketing budgets.
Planned channel investment increases for 2026
Source: HubSpot 2026 State of Marketing Report (1,500+ global marketers)
HubSpot's 2026 report shows that 79.2% of marketing teams expect at least a slight budget increase, but 73% report their budget receives more scrutiny than in the past. The top areas where brands plan to increase spend are AI chatbots (37.7%), paid social (37.4%), video marketing (37.1%), and content marketing (36.9%).
AI's impact on marketing mix efficiency
Salesforce's 10th State of Marketing report (February 2026, 4,500 marketers surveyed) provides the clearest picture of AI's impact on marketing effectiveness:
Measured impact of AI on marketing performance
Source: Salesforce 10th State of Marketing Report (February 2026, 4,500 marketers)
| Metric | Improvement | Source |
|---|---|---|
| ROI increase | +20% | Salesforce, February 2026 |
| Customer satisfaction | +20% | Salesforce, February 2026 |
| Conversion rates | +19% | Salesforce, February 2026 |
| Cost reduction | -19% | Salesforce, February 2026 |
| Time reclaimed per marketer | 8 hours/week | Salesforce, February 2026 |
| Business process acceleration | 30-50% | BCG, January 2026 |
Critically, 76% of marketers now use at least one form of AI, but only 13% use agentic AI — autonomous systems that can make and execute decisions. Of those using or planning AI agents, 82% expect major or moderate ROI improvements. ConvertMate's orchestration data shows that brands using multi-agent AI workflows for marketing mix optimization see a 31% improvement in cross-channel budget allocation compared to manual optimization.
Highest-ROI marketing formats in 2026
Beyond channel selection, the format of content matters significantly. HubSpot's survey of 1,500+ marketers reveals which formats deliver the strongest returns:
Marketing formats ranked by ROI (% of marketers reporting highest ROI)
Source: HubSpot 2026 State of Marketing Report
TikTok, Reels, and Shorts dominate for discovery and engagement
YouTube and webinars for consideration and conversion
Live shopping and events for urgency and conversion
Methodology and sources
This research combines ConvertMate's proprietary analysis with the most comprehensive 2026 marketing measurement data available:
- ConvertMate proprietary analysis: Channel performance data across 2,400 e-commerce brands in 14 verticals, tracking marketing spend, attribution, and revenue outcomes
- Gartner — CMO Spend Survey 2025, CMO Priorities for 2026 (December 2025, February 2026)
- HubSpot — 2026 State of Marketing Report (1,500+ global marketers)
- Salesforce — 10th State of Marketing Report (February 2026, 4,500 marketers)
- EMARKETER / TransUnion — MMM and Measurement Trends (November 2025)
- Nielsen — 2025 Marketing ROI Blueprint
- Omnisend — Key Ecommerce Digital Marketing Statistics (February 2026)
- First Page Sage — Average CAC for Ecommerce Companies, 2026 Edition
- Yotpo — 2026 Ecommerce Benchmarks (December 2025)
- BCG — From Campaigns to Business Value: AI in Marketing (November 2025, January 2026)
- Marketing LTB — Marketing Attribution Statistics (November 2025)
Optimization priorities
Based on our findings, we recommend the following priority actions for optimizing your e-commerce marketing mix:
- Implement basic MMM or incrementality testing — Even channel-level ROAS tracking with incrementality testing improves efficiency by 23%. Google Meridian and Meta Robyn are free starting points
- Shift from last-click to multi-touch attribution — 74% of high-growth companies use multi-touch. Start with time-decay or U-shaped models before investing in algorithmic
- Rebalance acquisition vs. retention spend — Repeat customers generate 44% of revenue from 21% of the base. Most brands over-index on acquisition at the expense of retention channels
- Maintain a 3:1 LTV:CAC ratio minimum — With CAC up 40% in two years, monitor this ratio monthly. A ratio below 3:1 signals that acquisition economics need attention
- Audit owned channel investment — Owned channels (email, SMS, SEO, content) deliver 4-18x the ROI of paid channels, yet most budgets skew toward paid media (30.6% of budget)
- Invest in AI-assisted budget optimization — AI delivers 20% ROI improvement and 19% cost reduction. Agentic AI for marketing mix decisions is the next frontier
- Test short-form video for organic discovery — 48.6% of marketers report it delivers highest ROI. But measure incrementality — organic reach alone doesn't prove contribution to revenue
Conclusion
The e-commerce marketing mix in 2026 is defined by a paradox: rising costs, tighter budgets, but dramatically better measurement tools. The brands winning this equation share three traits — they measure holistically (MMM + incrementality, not just last-click), they balance acquisition with retention investment, and they use AI to continuously rebalance budget allocation across channels.
With 59% of CMOs reporting insufficient budget and CAC up 40%, efficient marketing mix allocation has become a core competency for e-commerce growth. The data shows a clear correlation between measurement sophistication and marketing efficiency — and the tools to close that gap are more accessible than ever.
Frequently asked questions
What is marketing mix modeling and why does it matter for e-commerce?
Marketing mix modeling (MMM) is a statistical analysis technique that measures the impact of each marketing channel on sales. Unlike digital attribution (which tracks individual user journeys), MMM uses aggregate data to quantify the true incremental contribution of each channel — including offline effects, brand halo, and cross-channel synergies that digital attribution misses. For e-commerce, MMM is critical because CAC has surged 40% and 59% of CMOs lack sufficient budget, making every dollar's efficiency essential.
Which marketing channel has the highest ROI for e-commerce?
On a per-dollar basis, owned channels lead: email ($36-$42 per $1), SMS ($21-$71), and affiliate ($15). Paid channels return less per dollar (Google Ads $2-$4.50, Meta $2.50-$3) but drive top-of-funnel discovery at scale. The emerging channel to watch is AI search — visitors from ChatGPT and AI Overviews are 4.4x more valuable than traditional organic, with 3x better conversion rates and 527% year-over-year growth.
What is a good ROAS for e-commerce in 2026?
The average ROAS across all e-commerce is 2.87:1. Marketplace sellers should target 4:1+, while DTC brands should aim for 3:1+. Google Ads averages 2.95:1 (median), Meta averages 2.5-3:1, and TikTok averages approximately 2:1. Instagram performs significantly better for visual products at 8.83:1.
How much does customer acquisition cost in e-commerce?
The average e-commerce CAC ranges from $68-$84, with significant variation by vertical. Food and beverage is lowest at $53, while jewelry is highest at $91. CAC has increased approximately 40% over the past two years. The minimum viable LTV:CAC ratio is now 3:1 for sustainable growth.
How much should e-commerce brands spend on marketing?
The average marketing budget is 7.7% of company revenue according to Gartner. E-commerce brands typically allocate 7-12%, with early-stage brands spending 15-20%. Paid media comprises about 30.6% of total marketing budgets. HubSpot reports that 79.2% of marketing teams expect at least a slight budget increase in 2026, though 73% say their budget faces more scrutiny than ever.
How does AI improve marketing mix efficiency?
According to Salesforce's 2026 research (4,500 marketers), AI delivers a 20% ROI increase, 19% conversion rate improvement, and 19% cost reduction. High-performing teams reclaim 8 hours per week per marketer. BCG reports that AI agents accelerate marketing processes by 30-50%. Only 13% of marketers currently use agentic AI, but 82% of those who do report major ROI improvements.
Optimize your marketing mix
Use ConvertMate's multi-channel analytics to track ROI across every marketing channel and optimize budget allocation with AI.
Start optimizing free